
Model Data and its selection:
The NASA (National Aeronautics and Space Administration) Earth Exchange Global Daily Downscaled Projections (NEX-GDDP) dataset used in this study is comprised of downscaled climate scenarios for the globe that are derived from the General Circulation Model (GCM) runs conducted under the Coupled Model Inter-comparison Project Phase 5 (CMIP5) and across two of the four greenhouse gas emissions scenarios known as Representative Concentration Pathways (RCPs). The CMIP5 GCM runs were developed in support of the IPCC’s Fifth Assessment Report (AR5). The NEXGDDP dataset includes downscaled projections for RCP 4.5 and RCP 8.5 from the 21 models and scenarios for which daily scenarios were produced and distributed under CMIP5. Out of the 21 models, a subset of 6 models was chosen based on the selection done by Regional Integrated Multi-Hazard Early Warning System (RIMES). From the six models that were investigated, five global climate models (CMIP5) were chosen to analyse temperature and rainfall changes over the future in this study. The GCMs listed in Table 4.1 comprise the NASA (National Aeronautics and Space Administration) Earth Exchange Global Daily Downscaled Projections (NEX-GDDP) dataset. Each of the climate projection includes daily maximum temperature, minimum temperature, and precipitation for the periods from 1950 through 2100.
|
Downscaled GCMs (NASA GEX-NDDP data) |
Resolution |
Period for projection |
|
CNRM-CM5 |
25 km x 25 km (daily) |
2021 to 2050 & 2070 to 2099 |
|
IPSL-CM5A-LR |
25 km x 25 km (daily) |
2021 to 2050 & 2070 to 2099 |
|
MIROC5 |
25 km x 25 km (daily) |
2021 to 2050 & 2070 to 2099 |
|
MPI-ESM-MR |
25 km x 25 km (daily) |
2021 to 2050 & 2070 to 2099 |
|
MRI-CGCM3 |
25 km x 25 km (daily) |
2021 to 2050 & 2070 to 2099 |
Historical Climate and Future Climate Projections:
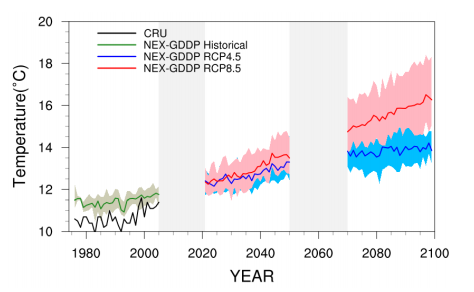
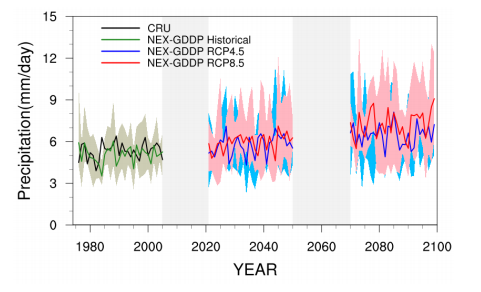 Figure 1 (Left) shows the future climate projection for temperature (ensemble of 5 GCMs chosen in this study), for Bhutan. The historical values are shown to compare GCM simulations with the observation and to suggest future projected trends. As depicted in Figure 1 (Left), the rise in temperature over Bhutan is evident under the future scenarios of RCP 4.5 and 8.5. There is a clear divergence of the signal after the mid-century. The RCP4.5 and RCP8.5 follow closely during the immediate future and differently by the end of the century. As to rainfall, an overlap is seen with higher values projected by RCP 8.5. The rainfall projection shows no significant increase on an average (Figure 1, Right), however, the variability within the model is large and increasing towards the end of the century.
Figure 1. Historical climate and climate projections for temperature (Left) & rainfall (right)
Temperature Projections:
- RCP 4.5 Scenario
A rise in the range of 0.8oC – 1.6oC is projected for annual mean temperature in Bhutan between 2021 and 2050. These changes are likely to be higher towards the end of the century (2070-2099) with expected increase in the range of 1.6o C – 2.8oC. Accordingly, the seasonal changes during 2021-2050 shows increase in the range of 0.9oC – 1.8oC over Bhutan and about 1.8oC – 2.8oC by the end of the century. Larger warming is indicated during MAM and DJF seasons. The country as a whole is expected to experience an increase in temperature with a larger increase projected in the high lands.
- RCP 8.5 Scenario
A rise in the range of 0.8oC – 2.0oC is projected for annual mean temperature in Bhutan between 2021 and 2050. These changes are likely to be higher towards the end of the century (2070-2099) with the expected increase in the range of more than 2.8o C. During 2021-2050, similar seasonal changes are expected to that of RCP 4.5 over Bhutan. However, more pronounced changes can be noted towards the end of the century in the range of 3.2oC – 5.6oC.
A detailed table of all these temperature changes on annual and seasonal time scales, during 2021-2050 and 2070-2099, under both the scenarios of RCP 4.5 and RCP 8.5 are provided in the attached document below.
Rainfall Projection:
- RCP 4.5 Scenario
Bhutan is likely to experience increases in annual rainfall between 10% -30%. While the increase in rainfall is likely in DJF in Bhutan, some parts of the northern and northern west are likely to experience a decrease in rainfall. During 2021-2050, Bhutan is likely to experience increasing trends in rainfall (Figure 4.13) with a marginal decrease towards the end of the century (2070-2099).
- RCP 8.5 Scenario
The increase in the rainfall during 2021- 2050 is in the ranges of 10-20% and with more than 30% increase all over Bhutan towards the end of the century. While the projections suggest increasing rainfall during the JJAS, the winter (DJF) seasons are likely to receive a decrease in rainfall in some parts of the country, in particular in the northwestern region of Bhutan. A marginal increase in rainfall trend is expected.
A detailed table of the projected increases of rainfall during 2021-2050 and 2070-2099 over Bhutan, on annual and seasonal time scales are provided in the attached document below.
Click here to download the report